Install the Command Line Interface (CLI)
The steps are consolidated from Trialhead modules.
The steps are consolidated from Trialhead modules.
- Download the CLI using the appropriate link below.
Operating System
|
Link to Installer
|
macOS
| |
Windows 32-bit
| |
Windows 64-bit
|
- Install the CLI through the installer.
- Make sure the Environment Path is set

4. Make sure the CLI is properly installed. Open the terminal app in macOS or the Command Prompt in Windows, and enter sfdx.
- You should see something like this:

- Download and install the latest version of Visual Studio Code for your operating system. If you already have Visual Studio Code installed, there’s no need to reinstall it.
- Launch Visual Studio Code
Get Familiar with the Interface
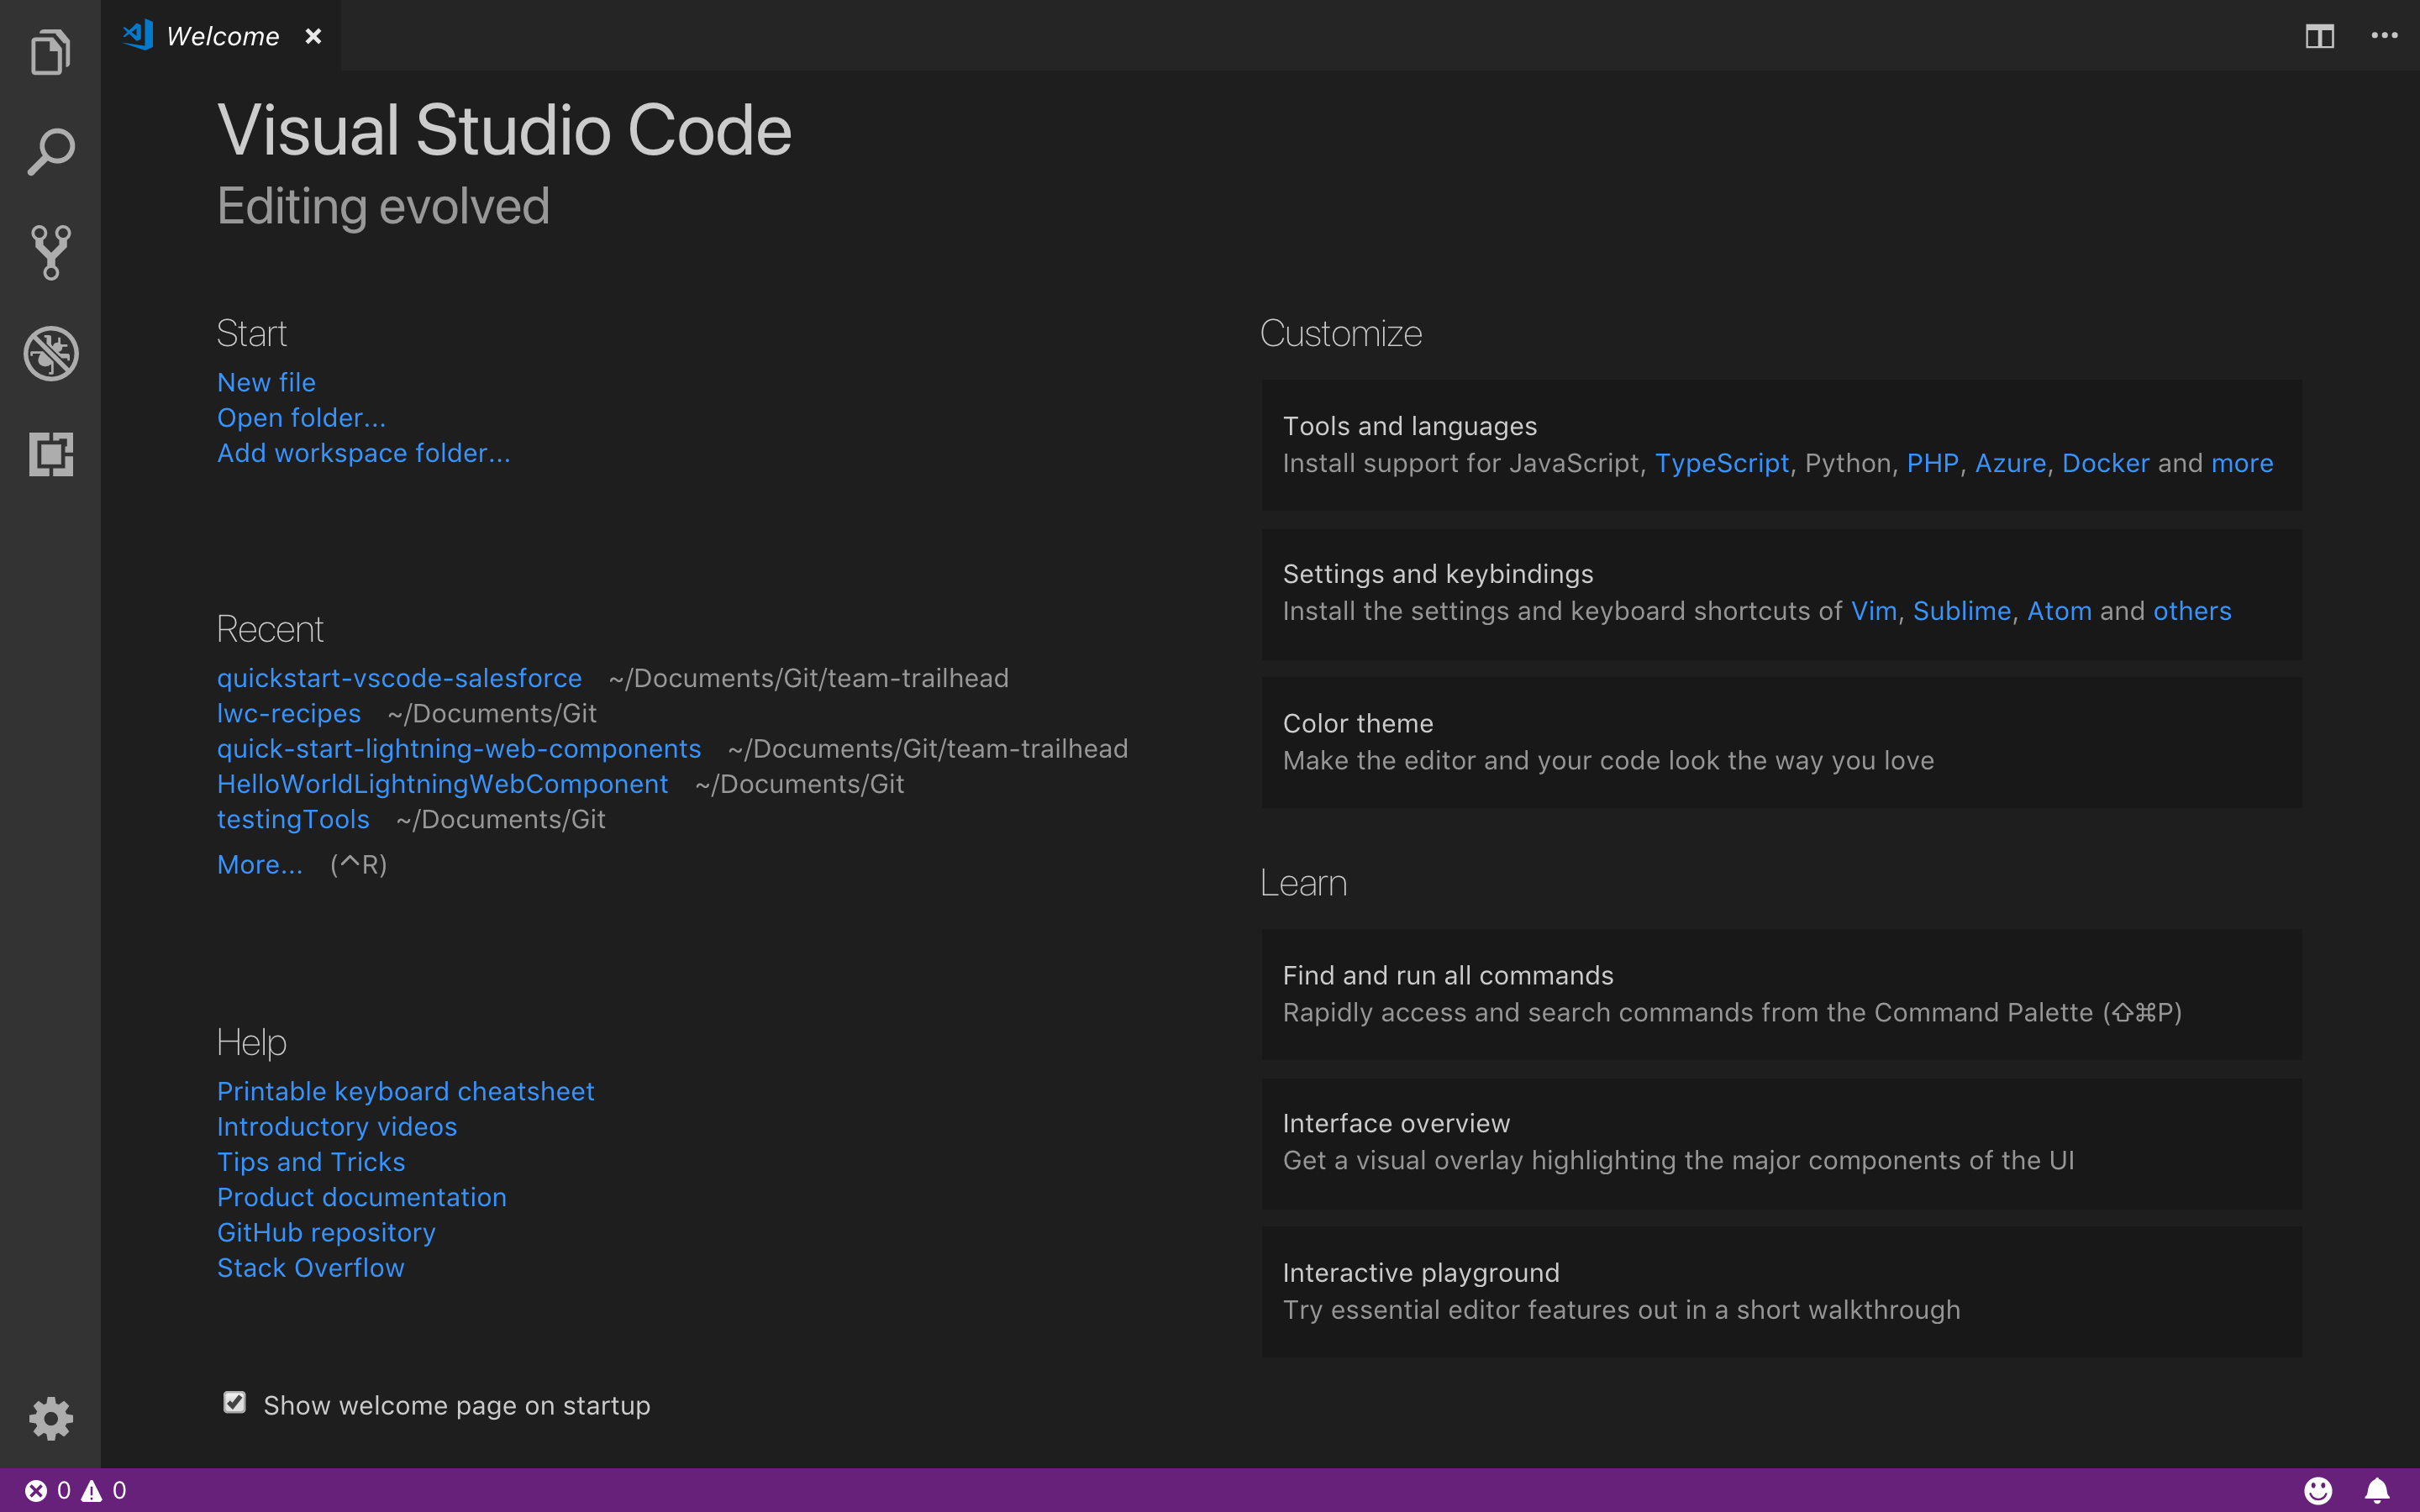
The welcome page for Visual Studio Code automatically opens the first time you run the application. This page has many shortcut links, such as getting started with a new file, learning about Visual Studio Code, or even customizing the interface according to your preferences.
- Launch Visual Studio Code.
- On the left toolbar, click the Extensions icon
 .
. - Enter
Salesforce Extension Packin the search field.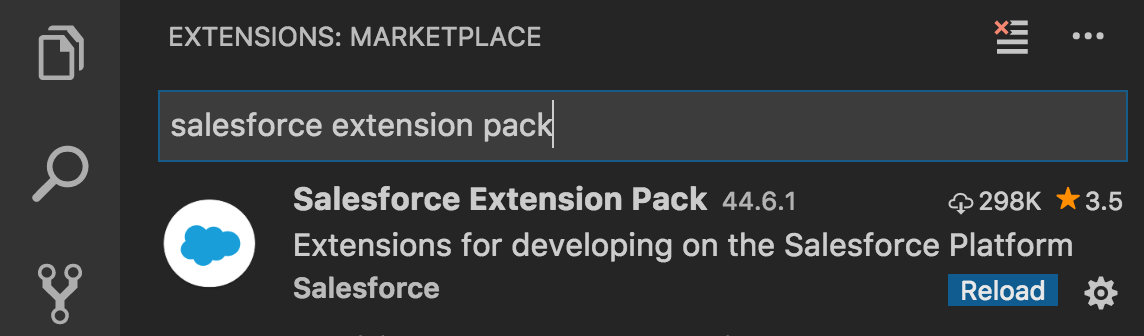
- Click into the card that says Salesforce Extension Pack.
- Then in the newly launched window, click the green Install button.

- Close and relaunch Visual Studio Code to complete the installation.
Command Palette
To view the quick open window, press Command + P on Mac or Ctrl + P on Windows.
If you type
? you can view the help menu. Through this module we will use the quick open window in command palette mode, which allows us to show and run commands.
Create Project
Please refer the following trailhead unit to learn how to create project
Quick Start: Visual Studio Code for Salesforce Development -> Use Visual Studio Code for Salesforce Development
Connect with existing ORG
- Press Command + Shift + P on Mac or Ctrl + Shift + P on Windows to make the command palette appear.
- New prompt starts with
> - Type SFDX: Create Project with Manifest
- Enter a project Name <Name of the project in VS Code>
- Choose a location in computer and hit enter
- This will create a project with a template in VSCODE
- Press Command + Shift + P and Type SFDX: Authorize an Org
- Select Project Default (https://login.salesforce.com)
- Enter Alias Name
- This will open a salesforce login Browser. Provide credential.
- Allow page will appear.
- Come back to VS code. You can see successful authorization message in output window. You may now close the browser.
- If you do not find LWC bundle in Package.xml, Please as follows
- <types><members>*</members><name>LightningComponentBundle</name></types>
- RightClick on Package.xml and click SFDX:Retrieve source from Org to retrieve new files.
- RightClick on force-app and click SFDX:Retrieve source from Org and to retrieve exisitng content.
- After that you can add/update files in location and deploy the code to org by SFDX: Deploy source from Org
Apex Replay Debugger with VS Code
Look for following trailhead project for detail learning.
Find and Fix Bugs with Apex Replay Debugger
“Any bug not detected in the design phase will cost ten times more time to detect at the coding phase and an additional ten times more at the debugging phase.” —Dr. Nikolai Bezroukov, The Art of Debugging
When trace flags are enabled, Apex code generates debug logs, that are recordings of all interactions in a transaction. Apex Replay Debugger simulates a live debugging session using a debug log. It presents the logged information, including variable values, call stack, and breakpoints, similarly to an interactive debugger, so you can debug your Apex code.
1. Install and.or update CLI

2. Install (or Update) for the Salesforce Extension Pack in VS Code
3. Install Java Standard Edition Development Kit 8
Confirm Java is properly installed by locating its installation directory. For example, C:\Program Files\Java\jdk1.8.0_201
Configure Java Home Setting for Apex Support
By default, Salesforce Extensions for Visual Studio Code attempts to locate your Java installation directory by looking for a
JAVA_HOME or JDK_HOME environment variable on your computer. You can also set the salesforcedx-vscode-apex.java.home setting to point to the Java installation directory you want to use, which is helpful when you have multiple versions installed. For this project, let’s configure Visual Studio Code settings to point to our JDK8 installation directory.- In Visual Studio Code, click File > Preferences > Settings (Windows or Linux) or Code > Preferences > Settings(macOS).
- Enter
apex javain the search box, then under the Salesforcedx-vscode-apex > Java: Home section, click Edit in settings.json.
- Change the
salesforcedx-vscode-apex.java.homesetting to the full path to your Java installation directory identified in the previous step. Note that for Visual Studio Code settings, the backslashes must be escaped (\\) but forward slashes (/) don’t.
- Relaunch Visual Studio Code to ensure the setting takes effect.
Create a Launch Configuration
A launch configuration tells Visual Studio Code how to start a debug session with custom debuggers such as Apex Replay Debugger. To create a launch configuration for Apex Replay Debugger, create or update your project’s
.vscode/launch.jsonconfiguration file.- In Visual Studio Code, click the Debug menu then choose Open Configurations. After a few seconds, Visual Studio Code loads the available debugging extensions and prompts you to select an environment.

- Select Apex Replay Debugger. If you do not see the option listed, make sure you’ve configured your
salesforcedx-vscode-apex.java.homesetting to point to your Java 8 home directory and restart Visual Studio Code.
- After a few seconds, Visual Studio Code opens the generated launch configuration file
.vscode/launch.json. If a configuration entry with the name “Launch Apex Replay Debugger” is not listed in yourlaunch.jsonfile, the Apex Replay Debugger extension may not have fully initialized yet. Delete thelaunch.jsonfile, and retry steps 1–2 to create the launch configuration again. We won’t make any changes, so go ahead and close the file after it's created successfully.
Debug Your Code
Follow trailhead project
Find and Fix Bugs with Apex Replay Debugger > Debug Your Code
Commands to remember:
SFDX: Invoke Apex Tests and choose file.
SFDX: Toggle Checkpoint
SFDX: Update Checkpoints in Org
Run Apex Test and Get debug
SFDX: Turn On Apex Debug Log for Replay Debugger
SFDX: Invoke Apex Tests and choose file.
SFDX: Get Apex Debug Logs and choose the file.
RePlay an Apex Debug Log
Open debug file from .sfdx/tools/debug/logs
Right Click and choose SFDX: Launch Apex Replay Debugger with Current File
Debugger will arrive at the check point.
HAPPY DEBUGGING......
LWC Local Development Beta
Local Development is a plugin for the Salesforce CLI. Eventually, this will ship with the Salesforce CLI out of the box, but for now you will need to install it by running the following command.
sfdx plugins:install @salesforce/lwc-dev-server
Once, the plugin is installed you can run the Local Development Server on your Salesforce project by running the start command. Note that you will want to be authorized into an org before you start the server so you can take advantage of the data proxy features. See the full documentation for details.sfdx force:lightning:lwc:startRefer following for more detail:

No comments:
Post a Comment